SPY Block Trades vs Standard Volume Charts Which Better Reveals Institutional Levels
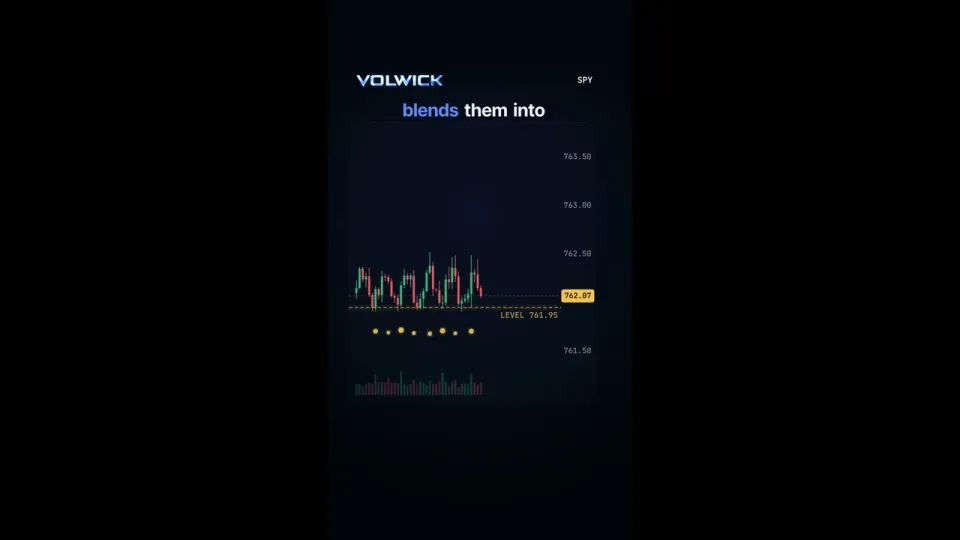
Video: SPY Block Trades Explained | Institutional Trading — VOLWICK
· based on the channel Volwick Official
Key takeaways
- A block trade is a single large executed transaction, typically negotiated privately and reported after execution rather than resting on the visible order book.
- Multiple large prints clustering at one SPY price level, such as 761.95, mark an area where liquidity was actually consumed, not just displayed.
- Standard volume bars aggregate all trading in a period and cannot separate one 500,000-share print from thousands of small retail fills.
- Block prints show what traded but not who traded: they do not confirm institutional buying or selling intent and do not predict direction.
- All P&L figures shown in the Volwick breakdown are hypothetical illustrations, not verified trading results.
SPY block trades are large, individually executed transactions that are reported to the tape after the fact, and they beat standard volume charts for one specific job: showing exactly where big orders changed hands. A volume bar tells you how much SPY traded in a five-minute window; a block print tells you that a single order of a defined size hit one price at one moment. That distinction is why traders watching liquidity and market structure overlay block prints on price rather than relying on volume alone. Tools such as the Volwick trading terminal exist precisely to visualize that executed activity next to the chart, including highlighted levels where several large prints stack up.
What a SPY block trade actually is and how it reaches the tape
A block trade is a single transaction large enough that it is usually negotiated away from the visible order book and then reported to the consolidated tape as one print. In SPY, the most heavily traded ETF in the US market, blocks are routine: the fund's deep liquidity and penny-wide quotes make it a preferred vehicle for institutions that need broad US equity exposure in a hurry. The mechanics matter for interpretation. A block does not sit in the order book waiting to be hit; it is typically worked out bilaterally or through a broker and then printed, which means the visible depth you see on Level 2 may never reflect it. By the time the print appears, the shares have already changed hands. That is why a single enormous SPY print can appear at a price where the displayed book looked thin, and why the print itself is the only evidence the trade happened. The key point for a trader is that a block print is a record of completed business, not an intention. It tells you size and price; it does not tell you whether the buyer was opening a hedge, closing a short, or rolling an index position.
Why block prints beat plain volume bars for spotting real liquidity
Standard volume charts aggregate every fill in a period, so a 400,000-share institutional block and 400,000 shares of retail-sized fills look identical. Block print data separates them. When several large prints land at or near the same price, that cluster identifies a level where substantial size was actually transacted, which is a different claim from a level where limit orders were merely displayed. Displayed liquidity can vanish; executed liquidity already happened. The Volwick breakdown illustrates this with a highlighted SPY level at 761.95, where multiple large prints appeared in proximity. That is the practical use case: not prediction, but context. A trader can mark the level, note that real size traded there, and then watch how price behaves on a return visit. Two outcomes are possible and both are informative. Price can hold the level, suggesting the participant who traded there is still active, or price can slice through it, suggesting the block was absorbed or hedged elsewhere. Volume bars cannot give you that granularity because they never distinguish one order from many.
How to read clustered prints at a single price level
Clustered block prints at one price create a reference point, and the useful work starts after the cluster forms. A practical sequence for reading a level like 761.95:
- Mark the exact price where the largest prints executed, not the midpoint of the cluster.
- Note the time of day. Prints during the closing auction window or around major data releases carry different information than midday prints.
- Check whether the cluster is a single print or repeated prints. Repetition suggests a participant working an order in pieces.
- Watch the first retest. Holding above a cluster where buying occurred, or failing below one where selling occurred, is the actionable observation.
- Combine with options-derived levels. Dealer positioning can explain why a price attracts size in the first place.
None of these steps produce a signal on their own. They produce a map of where real business was done, which is a starting condition for a trade idea rather than the idea itself.
Combining block prints with dark pool, dealer walls and CVD
Block prints are one layer of market intelligence, and they are strongest when read alongside off-exchange activity and options positioning. Dark pool prints capture supported off-exchange equity and ETF trading that never appears in the lit book, so a block print and a dark pool print at the same price reinforce each other. Dealer walls, derived from estimated options positioning, explain why certain strikes and prices attract hedging flow; a block cluster sitting on top of a large dealer level is more meaningful than one sitting in empty space. Cumulative volume delta adds the direction of pressure: if price is grinding higher into a block cluster while CVD rises, the prints are consistent with accumulation, and if CVD falls into the same cluster, the interpretation flips. The Volwick terminal bundles these views — dark pool, block prints, dealer walls, gamma exposure, CVD and integrated market intelligence — into one screen, which reduces the risk of reading a single dataset in isolation.
What block trades cannot tell you and where the analysis breaks
A block print does not identify the counterparties, the intent, or whether the trade was opening or closing, so any claim that a print proves institutional buying is an inference, not a fact. Large trades can be hedges against futures or options exposure, index rebalancing, ETF creation and redemption activity, or a spread leg that is meaningless in isolation. They also do not guarantee future price direction: a level where size traded can be revisited and broken without ceremony. Treat any P&L figure attached to a block-trade setup as illustration only. The hypothetical dollar outcomes shown in the Volwick video are exactly that — hypothetical examples, not verified trading results and not a track record. The honest framing is probabilistic: clustered prints raise the odds that a price matters to someone with size, and that is all.
Practical checklist for using SPY block data in 2026
A repeatable routine beats a one-off observation. Log every block cluster above a size threshold you choose, record the exact price and time, and tag whether the level later held or failed on retest. Over a few weeks you build your own sample of how SPY behaves around executed size, which is far more useful than any single print. Pair the log with the broader context: is SPY trending or rangebound, is implied volatility elevated, is there a scheduled event that would explain the flow? Review the clusters that produced clean reactions and the ones that did not, and look for the difference — usually it is the presence or absence of confirming options positioning or dark pool activity at the same price. Keep position sizing independent of how convincing a single print looks.
Conclusion
Block trades answer a narrower question than most traders assume: they show where large orders were executed, not what the executor intends. Compared with plain volume charts, they win on precision — a cluster of prints at a level such as 761.95 is concrete evidence that size changed hands there — and they lose on interpretation, because the motive stays hidden. Use them as one layer alongside dark pool data, dealer walls and CVD, and treat every outcome figure as hypothetical. The video breakdown above comes from Volwick Official, whose terminal is available at volwick.com if you want to see block prints, dark pool activity and options-derived levels side by side.
Questions & answers
What exactly counts as a SPY block trade?
A block trade is a single large executed transaction, usually negotiated away from the visible order book and reported to the tape as one print. In SPY, blocks are common because the ETF is highly liquid and widely used for broad US equity exposure. The print shows size and price only, not who traded or why.
Do block trades predict where SPY will go next?
No. A block print records completed business and says nothing about the participant's intent, which could be hedging, rebalancing, or closing a position. Clustered prints at one price mark an area worth monitoring, but they do not guarantee that the level holds or breaks.
How is a block print different from a volume bar?
A volume bar aggregates every fill in a period, so one large institutional order looks identical to thousands of small retail fills. A block print isolates the individual large transaction, letting you see the exact price and time where size traded rather than just the total volume.
What should I check alongside block prints at a level like 761.95?
Look for confirming off-exchange activity, options-derived dealer levels, and cumulative volume delta at the same price. A block cluster that coincides with a large dealer level and rising CVD carries more weight than a print sitting alone in an otherwise quiet price area.
Source: SPY Block Trades Explained | Institutional Trading — VOLWICK · Markdown version